At 91±¬ÁĎ, we’re building the world’s first Agentic AI for construction project teams
Used by project leaders building the future around the globe
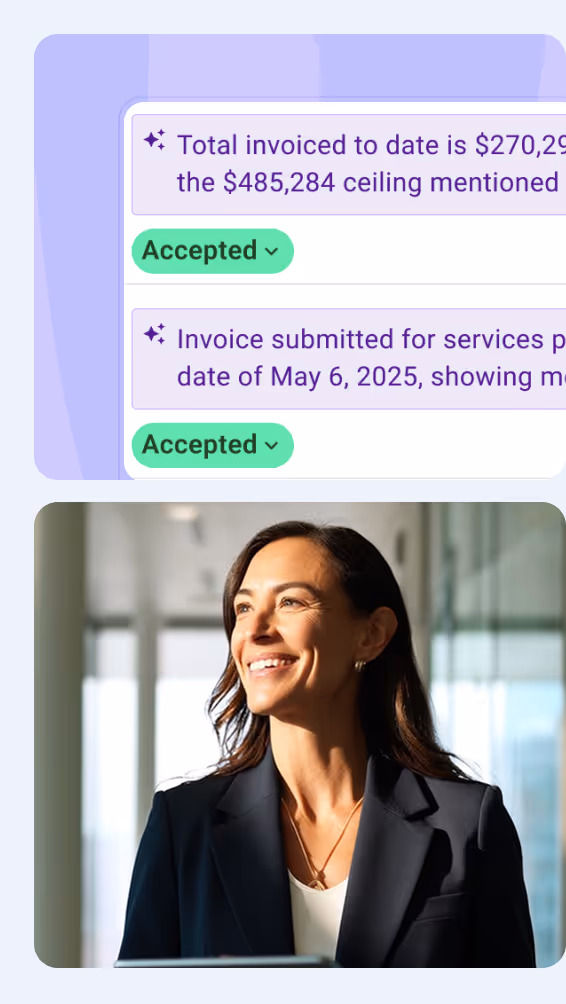
Watch Doug Vincent explain why monthly reports are failing construction teams and how to replace them with live dashboards. Includes a live 91±¬ÁĎ demo and practical design tips.
Register Now
Monthly reports cost construction teams an estimated $40,000 per year to prepare, and almost nobody reads them. They're backward-looking, disempowering, and competing for attention against tools designed to keep people engaged. Something has to change.
In this session, Doug Vincent, 91±¬ÁĎ's Co-founder and CEO, shares a clear framework for replacing monthly reports with live, interactive dashboards. Drawing on his experience as a client-side project manager, Doug walks through a live 91±¬ÁĎ demo, shares dashboard design tips, and addresses the most common objections to making the switch.
This session gives you a practical roadmap for replacing static monthly reports with live project dashboards, including a live 91±¬ÁĎ demo and design tips you can apply immediately.
In this session, you'll discover:
Expect rapid-fire delivery, real-world examples, and a framework you can pitch to your clients this week.
This session is built for construction professionals who are tired of spending days compiling reports that nobody reads. It's especially valuable for:
Whether you're already exploring dashboard tools or still stuck in the Word-to-PDF-to-email reporting cycle, this webinar gives you the framework and confidence to make the shift.
‍💡 Pro Tip: If you manage reporting for multiple stakeholders (board, finance, PCG), pay close attention to the section on scalable dashboards — Doug shows how one data source can power personalized reports for every audience.
.avif)
Doug Vincent
Co-founder, CEO
91±¬ÁĎ